
Once you have learned How to Insert a Chart and How To Add Data you may want to add some formatting to it. It is likely that the chart you inserted has a plain jane look to it, PowerPoint 2013 comes with a number of styles and layouts to help you learn How To Format a Chart in PowerPoint 2013 in seconds!
Change Layout
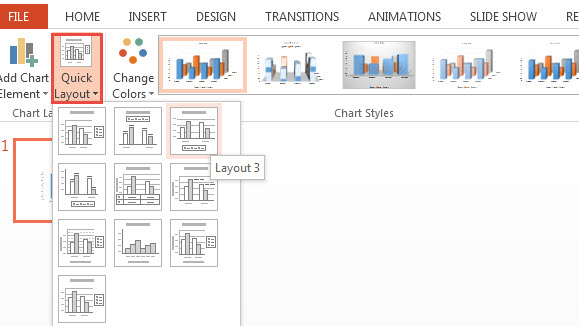
There are two options available to alter the layout. The first option consists of predefined layouts and the other allows you to tweak individual chart elements. Let us discuss how to access the Quick Layout option. Click anywhere on the Chart. Navigate to the contextual DESIGN tab on the Ribbon under CHART TOOLS and click it. Click the Quick Layout button on the Chart Layout group. This lists ready-made layouts to choose from. Hover the mouse over a layout to access its preview. Try out different layouts on free Waves PPT theme with a bar chart.
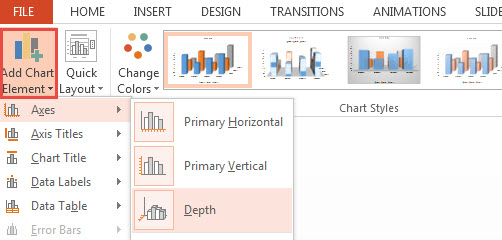
To change individual chart elements, click the DESIGN tab on the Ribbon under CHART TOOLS, followed by Add Chart Element on the Chart Layout group. This lists all chart elements, and possible formatting changes to apply on them individually.
How To Change Chart Style
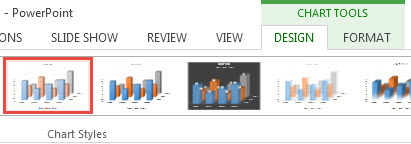
The easiest way to spruce up a chart is to apply a change in style. Do this by clicking the DESIGN tab, available on the Ribbon under CHART TOOLS. Choose your preferred style from the Chart Styles group. To view additional styles, click the button at the far right of the group. It displays a drop-down menu.
The above PowerPoint 2013 tutorial explained how to format a Chart in order to change its layout and style. To change layout, click the DESIGN tab under CHART TOOLS, followed by Quick Layout or Add Chart Element button. To change the style, click the DESIGN tab, followed by clicking the styles in Chart Styles group.
Leave a Reply