
Once you have inserted a Chart in PowerPoint 2013, the next step is to enter data into it. Each chart comes with generic data. You have to replace the generic data by your own. This tutorial shows How To Insert Chart Data in PowerPoint 2013, as well as how to format a chart (change its style, range, etc).
How To Insert Chart Data
After Inserting a Chart, an Excel worksheet appears by default. Insert data into rows and columns of the worksheet. Once all the data is inserted, click Close.
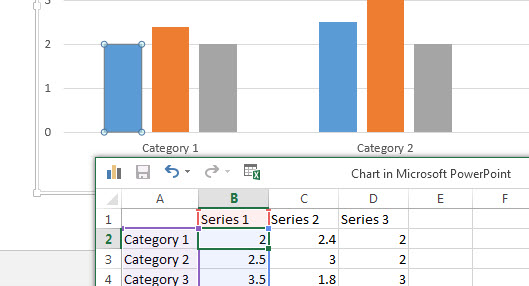
In case you have closed the Excel worksheet, reopen it by clicking anywhere on the Chart. Now Click the contextual DESIGN tab on the Ribbon. Locate the Data group and click the Edit Data button. A drop-down menu appears, giving you an option to Edit data in PowerPoint 2013, or Edit data in Excel 2013. You can practice inserting data by downloading a free PowerPoint theme with a built-in bar chart.
How To Enter Chart Range
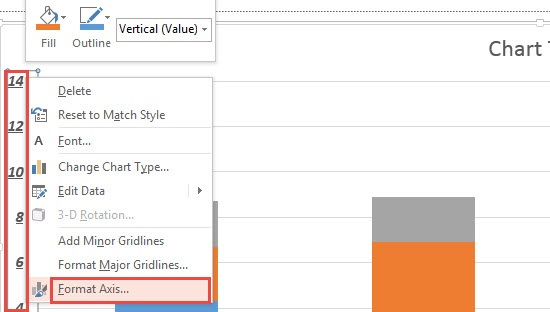
This feature enables the user to enter chart range, as well as to set the number of horizontal rows. Right Click the vertical numbering of a chart. A contextual menu appears. Click Format Axis. The Format Axis toolbar appears. Here, the user has an option to change the unit distance and boundary values.
The above tutorial explained how to Insert Chart Data in PowerPoint 2013 through data input using Excel 2013. It also showed how to set the range of values or Axes Formatting. Learn about Table formatting and Shape formatting too.
Leave a Reply