
If you’re new to PowerPoint or you’ve never made a PowerPoint presentation before, then you might be a little confused. While many people would painstakingly look for an option to insert a graph and try to figure things out by themselves, it is better to research these fundamental building blocks of PowerPoint presentations before jumping right in. In today’s article, we’ll be explaining how to make a simple graph in PowerPoint.
What is The Easiest Way to Make a Graph in PowerPoint 2013?
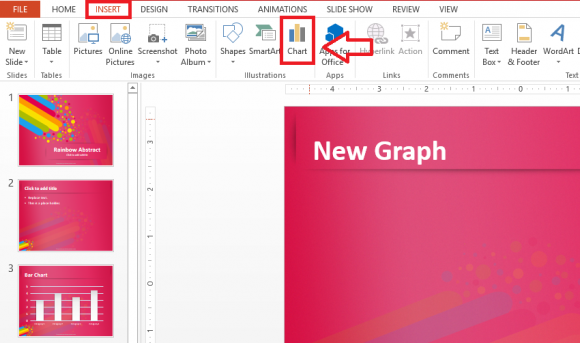
The easiest way to make a graph in PowerPoint is to click Insert from the Ribbon Toolbar and click Chart as shown in the the figure below.
It should automatically come up and ask you what type of chart you want to add.
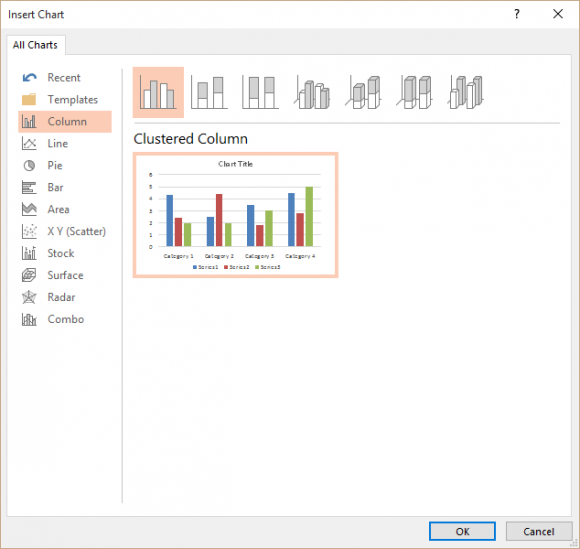
We’re going to be selecting a simple column chart here, but you should choose the most suitable one for your data. Think about how you want people to see your data. There are many types of graphs in PowerPoint. Select one and click OK to continue.
How To Edit a Graph in PowerPoint?
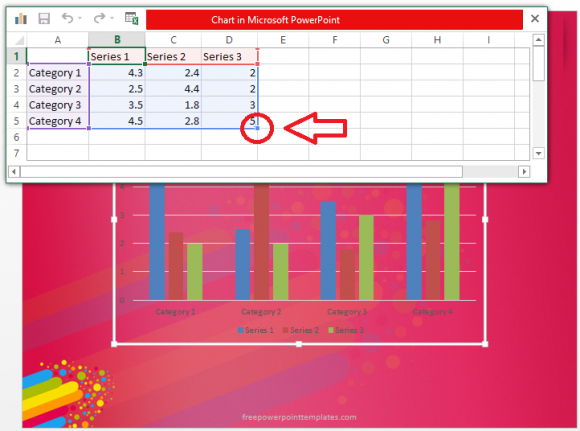
If you’ve followed the above instructions, a graph should appear with an Excel table filled with default values. Graphs are implemented in PowerPoint using Excel. Change any value and click Enter to see the chart change accordingly. You can also add more data by typing it in or pasting it over from Excel.
If you want to add another column or row into the chart, you will need to re-size the blue chart area by clicking and dragging this blue box.
(Click here to download the PowerPoint template in this example)
The process of making graphs has only changed a bit in different versions of PowerPoint. Most of these steps should be almost identical in other past and future versions of PowerPoint. Making graphs instead of showing a spreadsheet helps people visualize the data, but using correct graphs is also important. Click here to learn about what graph you should be using to show trends.
Leave a Reply