As a presenter you might have to explain different types of processes to your audience. These process may be about manufacturing; business solutions; or putting together a plan. It is your job to explain it in a convincing way to your audience. Most people will just use a numbered list to represent steps in a process, but not everything is best explained this way. In this blog we will be exploring some ways how you can better show steps in a process. Lets get started.
How To Make Process Diagrams in PowerPoint
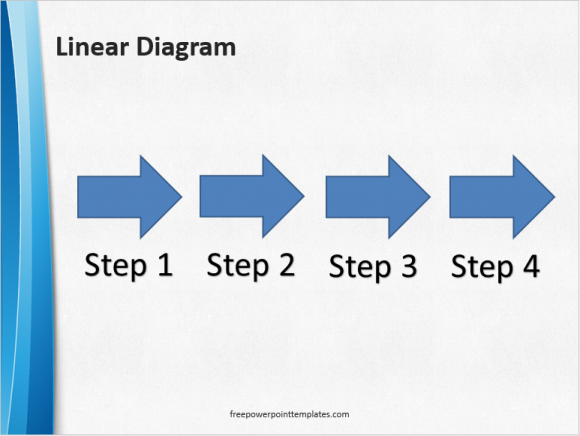
Depending on your presentation, you might be dealing with different types of processes. The most common is a linear process. A linear process can be represented by using the same shapes to represent each process. You can make these by using simple shapes in PowerPoint.

Use SmartArt to Make Diagrams Faster
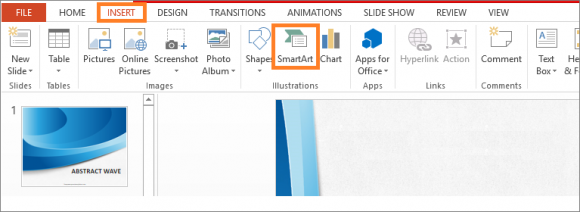
Make process diagrams using the SmartArt option if you’re in a hurry. They look nice and they’re easy to make. Click Insert from the ribbon, and click SmartArt.

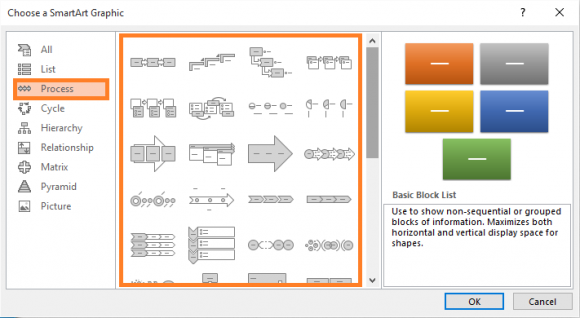
You should see a dialog box containing pre-made SmartArt graphics. Click Process or Cycle, and click one that suits your needs. There are other types of useful diagrams there as well.

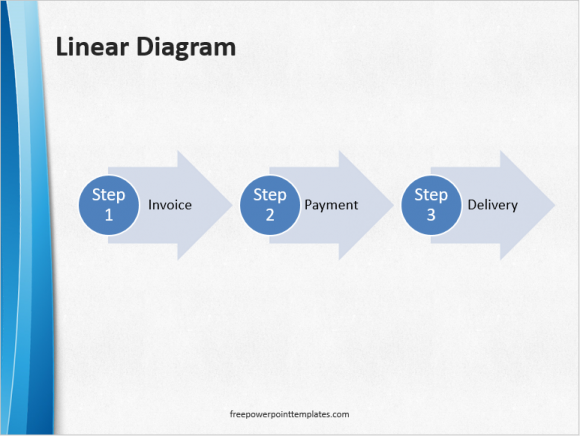
The diagrams are pre-made, all you need to do is adjust their size and fill their labels.

(Download this PowerPoint template by clicking here)
You can choose to represent each step with its own picture as well. Give each step its own image instead of an arrow to help people better understand what is happening there. Some processes have a starting point and an ending post, others repeat in a loop. Choose a diagram that best represents the process. Use the built-in SmartArt feature to make process diagrams easily, or use shapes and drawing tools if you want more customization options. Don’t worry if you haven’t done this before, they’re really easy to make in PowerPoint. Good Luck!

Leave a Reply