Use smart graphics according to the theme and subject of the presentation to make it impactful. Presentations dealing with percentages are most effective when the data is illustrated through charts, graphs and diagrams. Download this Free Graphics Sampler PowerPoint Template and edit it inside the browser. This Free PowerPoint theme features a variety of sampler layouts to use in a Census, Risk management, Actuary, Financial Analyst or Economist presentation.

Smart Graphics Sampler Slides
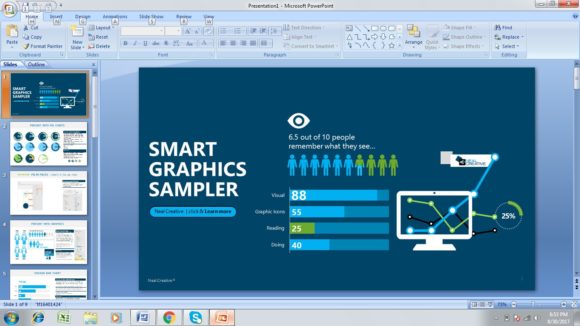
There are a variety of layouts for your presentation, accompanied by instructions regarding how to use, edit and change the graphic to match your requirements. The second Free Data Analysis PPT slide helps understand how effective it is to use graphics and visuals. Examples of data analysis presentation topics include a Case Study, or a Medical finding.
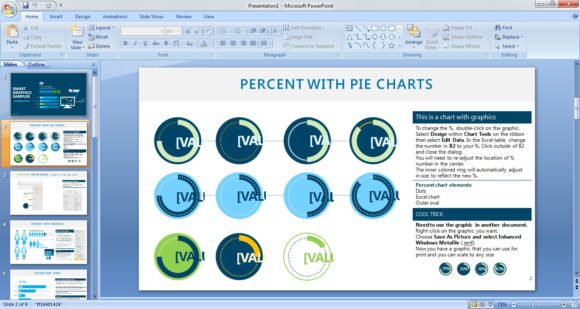
Next slide provides a pie chart layout to illustrate data in a graphical form. Read the instructions mentioned in the slide regarding how to edit the percentage data of the pie chart. There is also a cool trick mentioned in the slide to use this smart pie chart in any other presentation. Now, customize the color and settings of the pie chart according to your percentage data.

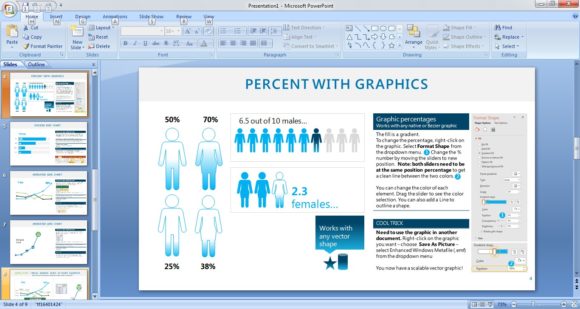
This sample slide provides a percentage with graphics layout. Instructions describe how to toggle the data. You have the option change the colors of the elements. These graphics like the pie chart in the previous sample slide are usable in other documents.

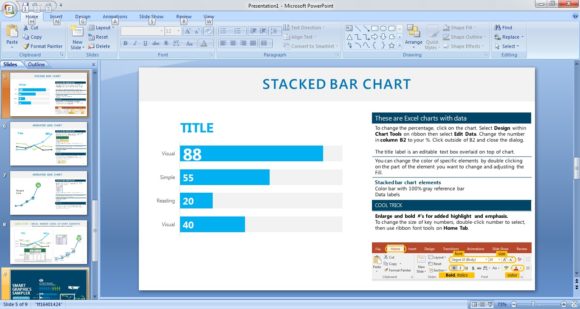
Remaining three sample slides provide a stacked bar chart, an animated line chart and a guide to the chart elements. These graphics also provide customizable features. Width and color of lines and text boxes is changeable using the instructions provided with each graphic. The graphics in this sample slides are customizable through Microsoft Excel.

Download this multi-purpose Free Graphics Samples PPT theme. Run it either inside the browser or open it with your favorite presentation tool, such as Microsoft PowerPoint 2016 or Keynote.

Leave a Reply