Many people are not aware of PowerPoint’s capacity to create diagrams and vector drawings. They think that a graphics editor is required to do any graphics related work. Presenters will find that plenty drawings can be conveniently made from PowerPoint itself. PowerPoint can be used to make beautiful vector drawings and proportional shapes to illustrate various points in a presentation.
Illustrate Relative Size in PowerPoint
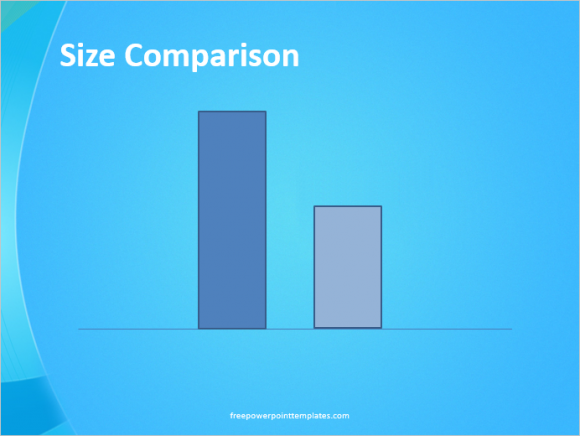
There are times when you may need to show how two objects relate to each other in terms of size and dimentions. It is better to use a diagram of these objects instead of using a graph to show how big or small they are from each other. This can be easily accomplished using basic shapes, but they should look similar to the actual objects that need to be compared e.g. two rectangular shapes for buildings.

(Click here to download the PowerPoint template used in this example)
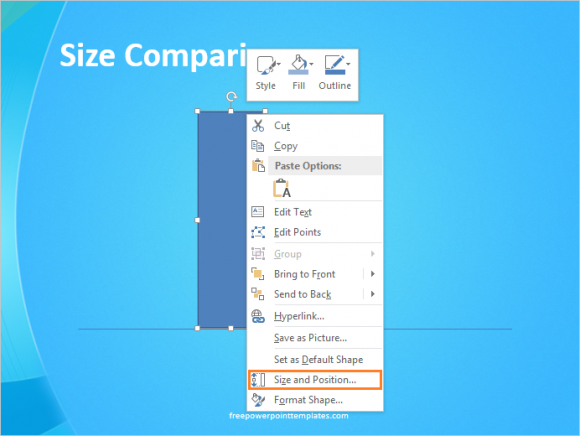
In most cases, you’ll also need to make these drawings proportional. You can do this by converting the size of the two objects into percentages and then applying the percentages to the sizes. For example, you may have two objects that are 350 and 430 units. You can calculate the percentage like so: 350/430 (bigger # on the bottom) = 0.814 (approx) = 81%. Now, you can draw the bigger shape as big as you want on the slide, and then make the other shape 81% of its size. Right-click the bigger shape and click Size and Position… to see its size in PowerPoint.

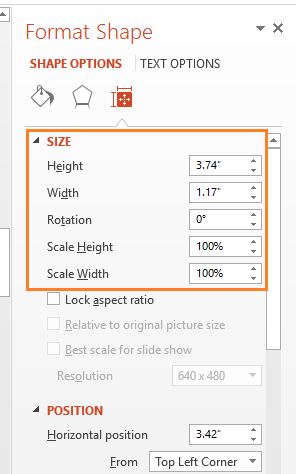
In PowerPoint 2013, you should be able to see the size on the right side of the screen.

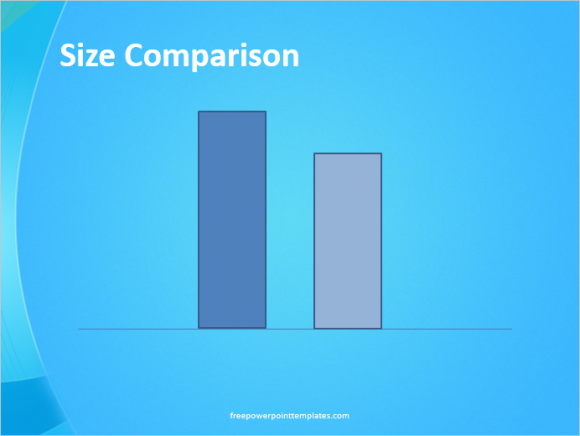
Here, we need to adjust the height of the drawings. So, we will multiply the height with the percentage: 3.74″ x 81% = 3.74*0.81 = 3.0294 = 3.03″. Now that we have the height of the smaller shape, we will Right-click the smaller shape and click the Size and Position… options to change its size, and get a proportional drawing.

You may need to use some simple math to figure out the size for some shapes you want to draw in PowerPoint if you want to draw them proportionally.

Leave a Reply