
Graphs are one of the most basic components of any PowerPoint presentation. A simple graph helps people visualize data and see trends in a way not possible with tables. A simple and minimal graph is usually best to ease complexity. This is where small details can really stand out, which is why learning how to clean up a graph is an important skill to have.
For the Newbies
If you’re new to PowerPoint then you might want to read our previous article on how to make a simple graph in PowerPoint. Knowing the fundamentals is important, so I recommend that you read that article before reading this one if you’re a beginner to PowerPoint.
How To Clean Up The Default Graph
Now that you know how to make a default graph, lets learn how to make it look better. In most cases, you’ll be using a PowerPoint template to make your presentation. This can be a temple from your organization, or one of the many great templates available online for free.
The appearance of your graph will depend on the template. While there are some really great templates out there, many of them may not have the formatting you’re looking for in your PowerPoint presentation. There are some annoying features that some graphs have. Here we will tell you how to get rid of these and make your graph look a lot more presentable.
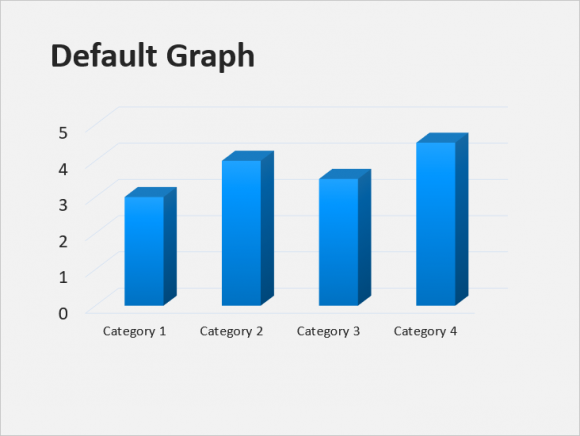
Remove 3D Formatting
We’re going to clean up a 3D effect. These effects look a bit distracting and they don’t really help us, so we’re going to clean them up.
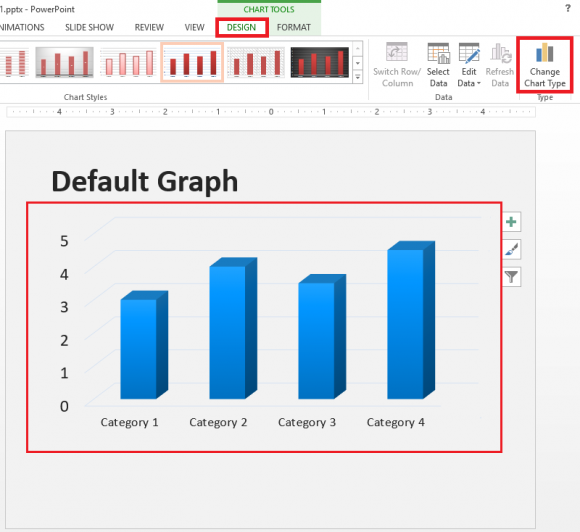
In PowerPoint 2013, click the graph and then click DESIGN under CHART TOOLS on the Ribbon toolbar at the top. Then, click the Change Chart Type button to select a different design for the graph.
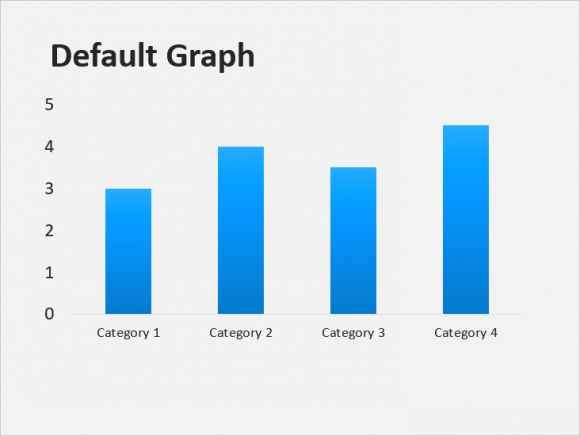
It looks a lot better now.

Remove The Lines in the Background
You can remove the horizontal lines in the background by clicking one of the lines and clicking the delete button. When you click the line, make sure that it is highlighted. In most graphs, clicking one of these lines highlights all of them since they are grouped together. This will make it easier to delete them.
There are many other things that we can do to make this graph look even better. Please look forward to our next article on optimizing graphs in PowerPoint.
Leave a Reply