
Pie charts are commonly used to show parts of a whole. They consist of a circle divided in different parts. The rectangles in a pie chart are called wedges. Many experts advise to stay away from these charts. This is because research indicates that they are not very useful in showing differences in similar sized wedges. However, pie charts remain widely used in PowerPoint presentations because of their simplicity. Today, we will look at some ways of using pie charts more effectively.
Make The Message Clear
All too often, we see charts like this where the audience is trying to find a pattern in the data, a pattern that isn’t really there. This is because many presenters are in a hurry to show the pie chart. What they should do is introduce the pattern or trend they want to show in the graph first, and then show the graph.
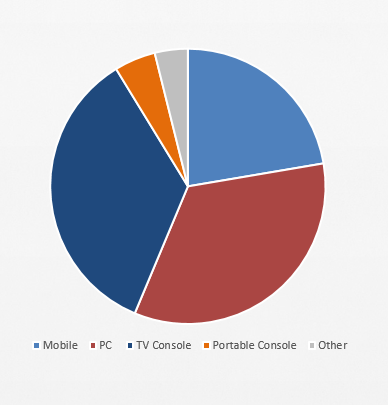
What is the message here? Is this a comparison of PC and console versus everything else? If this was really meant to be a comparison then it would be better to use a column or bar chart instead. Wedges also seem to be very similar in size, making it very hard to tell of they are more or less than each other by looking at the pie chart alone.
Also, using values that are too small can also limit the usefulness of a pie chart even of percentages are written. Zero values and negatives are also not suitable for pic charts.
What is a Good Use of a Pie Chart?
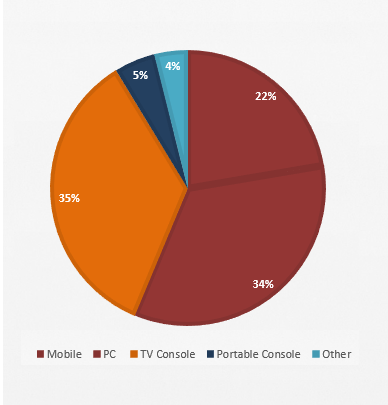
Use a pie chart when comparing no more than 4 to 5 categories. If you’re comparing 6 or more categories, then try using a Treemap chart instead. Make sure to have wedges labeled with percentages, and use contrasting colors for each wedge.
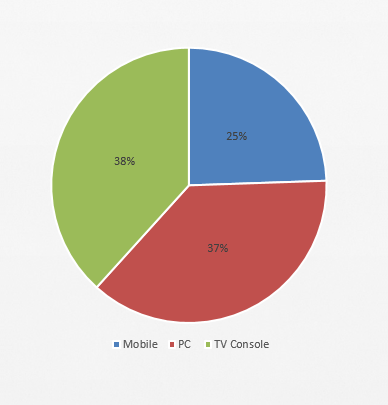
You can also group two categories to show a pattern.
Here, we can see that our target market (PC and Mobile) has more than half of the market share. Seeing these grouped pie charts after looking at a normal pie chart can help your audience better understand the points your’re making in the presentation.
Leave a Reply