
Diagrams are often used to illustrate how a task is completed through different processes. Therefore, different types of diagrams are used to represent different processes. Some diagrams work better than others when explaining a process. So, make sure to use the right one. Here we will be looking at 3 types of process diagrams. Lets get started!
Process Diagram for Linear Processes

(Download this PowerPoint template by clicking here)
The most common type of process diagram is the linear process diagram. These are fairly simple to illustrate using the various templates available in PowerPoint. In PowerPoint 2013, click the Insert tab and then click SmartArt.
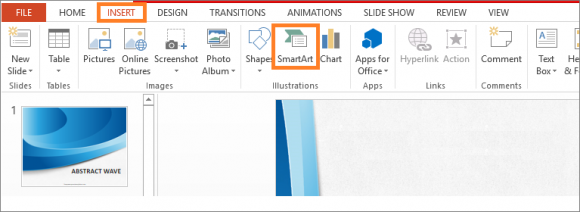
From the list of SmartArt graphics, click Process from as shown below.
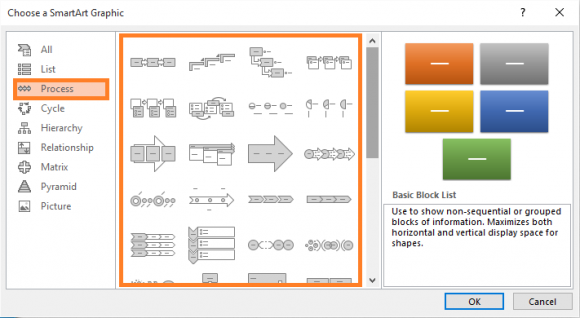
Here, you will find a wide variety of Linear process diagrams to choose from.
Process Diagram for Circular Processes
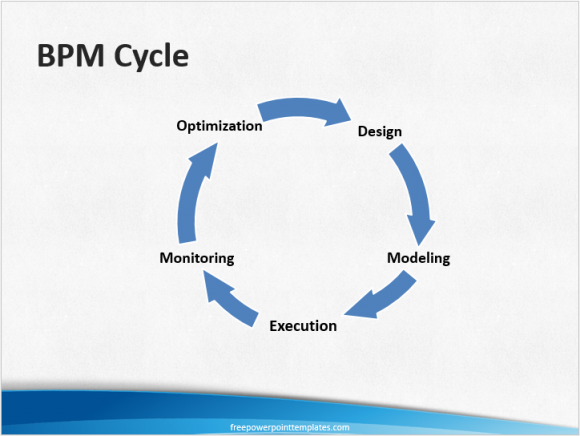
Circular process or cycle processes repeat in a continuous loop. They are fairly common and can be easily made using diagram templates built-into PowerPoint.
In PowerPoint 2013, click the Insert tab and then click SmartArt.
From the list of SmartArt graphics, click Cycle from as shown below.
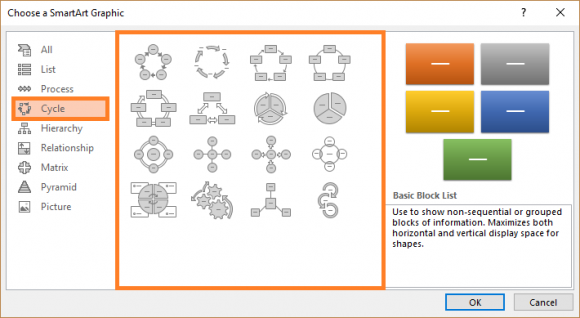
Now, choose a circular process diagram suitable for your needs.
Process Diagram for Mixed Processes
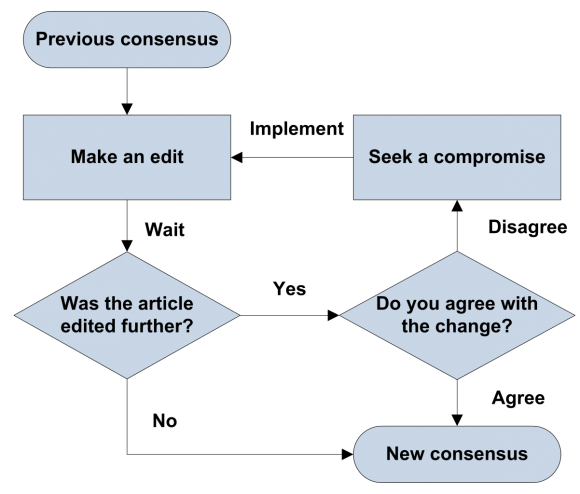
Mixed process contain both cycle processes and linear processes. Therefore, these processes are represented using Flow chart diagrams. The most common form of Flow Chart diagrams is the process flowchart.
You can make any flowchart you want using basic shapes in PowerPoint. They are fairly simple to draw since they are made using simple shapes. You can find basic shapes by clicking Shapes under the Insert tab in PowerPoint 2013.
However, you can’t use any shape in the Flowchart to represent whatever process. That is because each shape represents a different type of process. You can read about basic Flowchart components and their usage by clicking here.
You can also try using SmartArt Graphics to make a more fancy looking flowchart using these instructions.
Image: [CC BY 3.0] via Wikimedia Commons
Leave a Reply