
Tables and graphs are used to visually represent points of data. They can help make data easier to understand, but they can also cause confusion if not used correctly. Here, we will be discussing some tips on how to use tables and graphs in a PowerPoint presentation.
What is a Table?
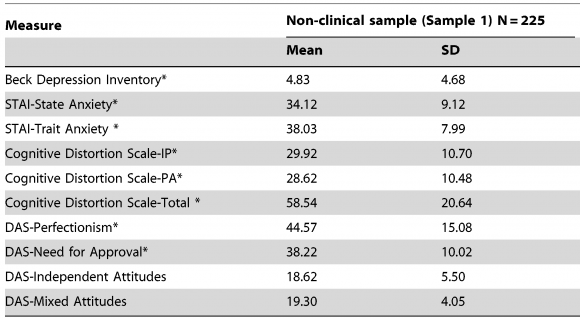
A table is a set of columns and rows that contains data. Don’t include too many rows or too many columns in a table if you’re going to use it in a PowerPoint presentation. Tables can be really boring because they only contain data and no visuals. Graph are made using data from tables.
How to Make Tables More Presentable?
You can make a table easier to read by using a different color for the heading text’s background on the first row of the table as shown above. You can also try interchanging the color of each row. This makes the table much easier to read. Try animating the graph by revealing parts of the graph as you talk about them. You can learn how to do this trick easily by reading this.
What are Graphs?
Graphs are used to visually represent one or more sets of data. There are many different types of graphs, but the most common types of graphs are bar, line, area, pie, and column. Graphs usually contain a title, lines, colors, and labels.
Each graph (or chart) has its own advantages and disadvantages. The pattern that can be shown with a line graph cannot be shown using a pie chart. A relation between parts of a whole that can be easily shown using a pie chart is not suitable for a line graph. Read about graph types before using them in your presentations.
Making a Graph
Most modern office software has graph building tools for making and editing graphs. Advanced graph making tools are also available for people who need to make really complex graphs. Making a simple graph in PowerPoint varies among different versions of PowerPoint. You can usually make a graph by clicking Insert > Chart
Image Courtesy:
Bar Chart [CC BY 0] via Pixabay
Table 1.. by Özdel K, Taymur [CC BY 2.5] via Wikimedia Commons
Leave a Reply