
Many professionals rely on presentation software to convey their message to their audience. As a professional, your job is to spend your time in finding solutions and communicating them to others. Using the right visuals is key to present your message effectively. This is supposed to be easy but sometimes it can be really difficult to select the right visuals between common ones like column charts and bar charts.
You may find yourself in a situation where one type of graph is better than the other. Here are two common charts and some scenarios where one is better than the other.
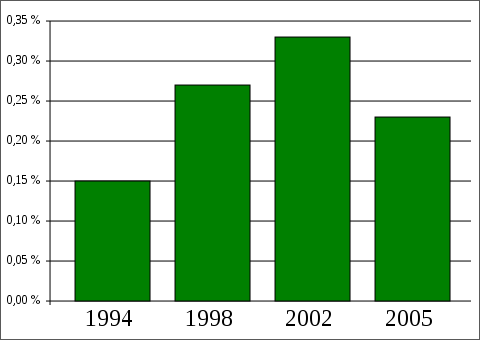
Column Charts
A column chart is a graphical representation of data in a table. It represents the data as vertical bars on a horizontal axis. Column charts are very simple in their structure, and are commonly used to make comparisons.
Bar Charts
A bar chart is very similar to a column chart, and is even sometimes called a column bar chart. It represents data as horizontal bars on a vertical axis.
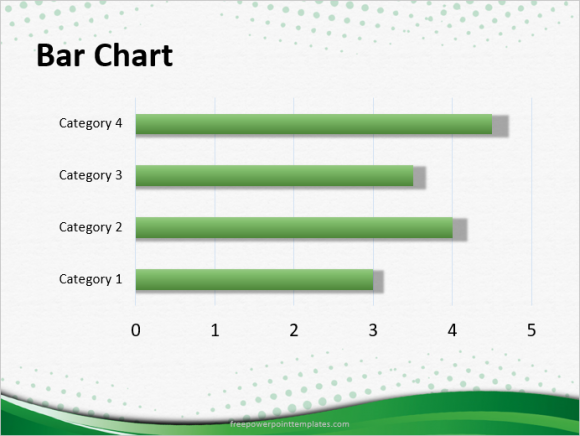
(Click here to download the template used in this example)
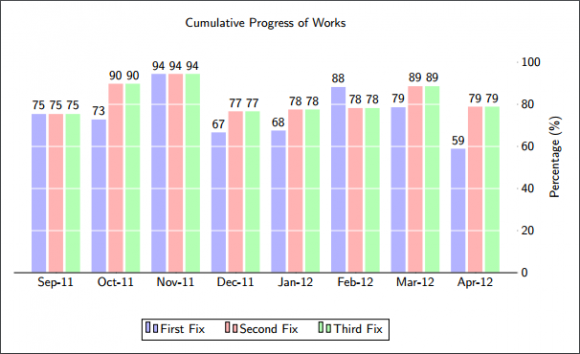
Comparing Items That Come one After Another in a Sequence
You might think that column charts or bar charts would work equally well for this scenario, but a column chart actually works a lot better. In this case, the sequence may be represented by time or something else.
Some examples are: showing events on a timeline, and resources of factories situated from west to east geographically.
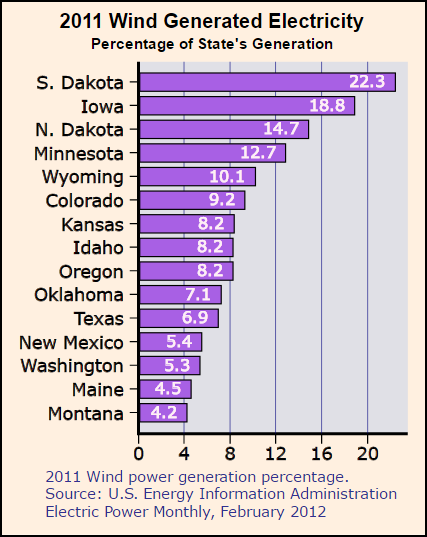
Comparing All Items with Focus on One
Once again, you might think that both charts will work equally well, but a bar graph will actually work better. There are some cases where you need to compare larger values against smaller ones. For example, showing benchmark results for various products, or comparing the total cost of various methods to solve the same problem. Keeping focus one large bar helps visualize the proportion between results.
Images:
Jake [CC BY 2.5] via Pgfplots.net
Aflafla1 [CC BY 3.0] via Wikimedia Commons
Dbenzhuser [GNU Free Documentation License] via Wikimedia Commons
Leave a Reply