
Visuals made from data are what make presentations superior to reading data from tables and plain text. When you’re using a visual, you want to make it as easy as possible to understand. Choosing an effective visual for data and Choosing an effective visual for words that closely matches what you want to show can be difficult.
Examples of Excellent Visuals for Representing Data
One thing you can do is take tips from real world examples of excellent visuals by various organizations. Graphics, such as those shared by news organizations are in the public eye, which means that people tend to expect more of the similar quality.
How To Get Regular Exposure To These Visuals?
You can follow certain Twitter accounts to see excellent visuals on a regular basis. I want to point out that by sharing Twitter accounts of these organizations, we are only endorsing the use of visuals in relation to data and not the content itself.
Here are some examples:
New York Times: https://twitter.com/nytgraphics (click the link for more)
Updated: Which countries received the most asylum applications in 2015 https://t.co/kjPCq513ut pic.twitter.com/8Jc5YPMDBd
— NYT Graphics (@nytgraphics) December 23, 2015
Washington Post: https://twitter.com/PostGraphics (click the link for more)
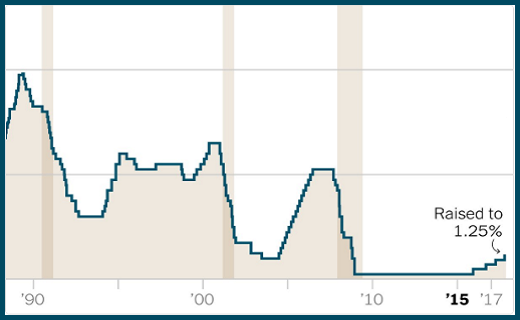
Correcting a typo in the original chart pic.twitter.com/o73l91ic2x
— Post Graphics (@PostGraphics) June 16, 2017
Bloomberg: https://twitter.com/BBGVisualData (click the link for more)
…while in the U.S., wind and solar already cost less than coal https://t.co/VVY9kAiH43 pic.twitter.com/PplEjRrb5T
— Bloomberg Graphics (@BBGVisualData) June 15, 2017
Most of these example Twitter accounts feature graphics on Business related topics and some Political topics as well. Some of these are interactive graphs in case you wanted ideas on how to make interactive visuals for sharing on the web.
You do not need to have a Twitter account to open these links, but you will need a Twitter account if you want to follow any of these to get updates.
The Benefit of Using Such Visuals as Examples
Financial presentations can be confusing for the audience. Especially when they are full of numbers. Sometimes a presenter has no choice but to use spreadsheets or wrong graphs when they don’t have the tools to make better visuals for all the sets of data. By using ideas from these sources, your presentations will be way ahead of those made from simply pasting Excel spreadsheets in PowerPoint.
Image: NytGraphics
Leave a Reply