
Presenters often copy data from their Excel sheet to PowerPoint and use it in their presentation. People might not be as familiar with the numbers as you are, making the numbers difficult to understand. So, presenters normally use visuals like charts to show numbers to their audience. Normal charts, however, are not the best way to compare data. For this you need to use a comparison chart instead.
What is a Comparison Chart?
A comparison chart is used when two sets of values need to be compared to each other. You can use this chart when asked to compare last year’s figures with the current year’s figures. You could also use it to compare this year’s performance to projected performance or a comparison of this year’s performance with a standard that the company is trying to adhere to.
How to Make a Comparison Chart?
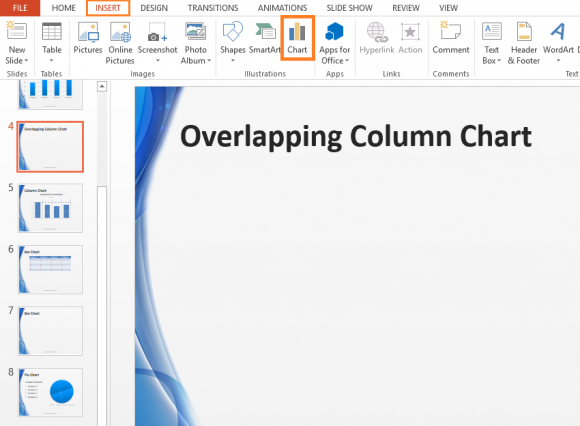
You can make a comparison chart in many different ways in PowerPoint. This is how to make one using PowerPoint 2013, but it should be pretty similar in different versions of PowerPoint. All you need to do is to click Insert, and then click Chart.
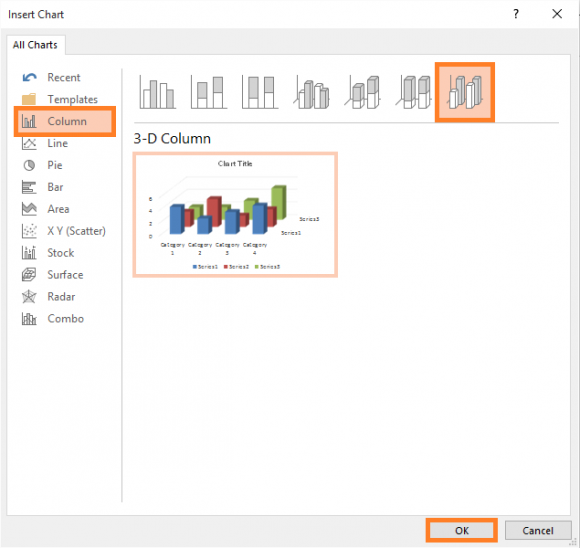
Select a chart from the list that fits well with your data. For most generic data, click Column and then click the 3D Column icon.
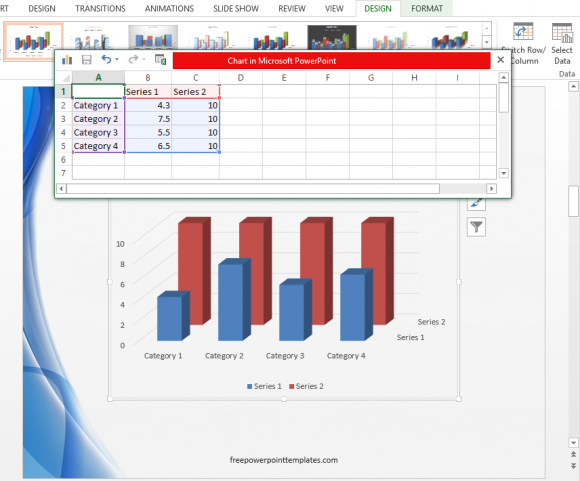
Enter the data in the table or paste your own table from an Excel sheet here.
(click here to download this PowerPoint template)
Double-click on the chart to see more settings. Color of the bars, their length, and size can be changed easily from here.
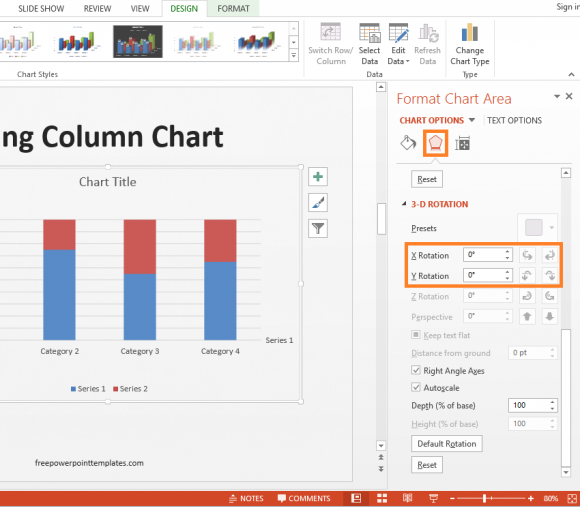
How To Make a 2D Comparison Chart?
You can turn this into a 2D chart as well. Double-click the above mentioned comparison chart to see additional options. In PowerPoint 2013, click Effects, and expand 3D-FORMAT.
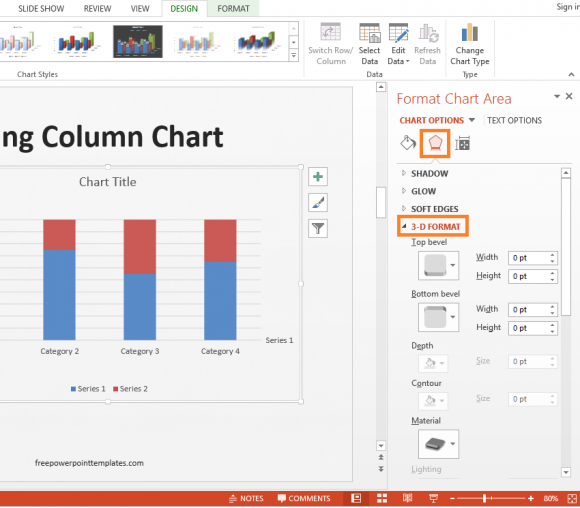
Scroll to the end of the list. Under 3-D ROTATION, change X Rotation and Y Rotation to 0 (zero).
Leave a Reply