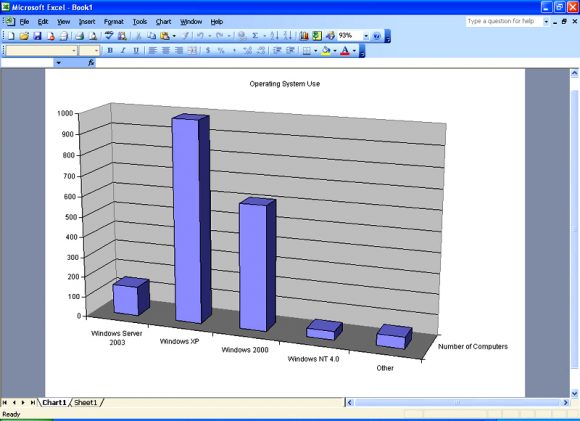
Microsoft made some big changes in how graphs are made in PowerPoint back in 2007. In earlier versions of PowerPoint, graphs were created using a different process even though they looked almost the same. This sometimes causes a bit of confusion for some people who have to copy graphs from old PowerPoint files. Today, we will explain the differences between the old and the new PowerPoint graphs.

The New PowerPoint Versions Use Excel to Make Graphs
In the past, PowerPoint used to have its own set of tools for making graphs. But, since PowerPoint 2007, graphs are made using Excel. This makes a lot of sense, because most of the time, the data to make these graphs also comes from Excel.
Editing a PowerPoint 2003 Graph in PowerPoint 2007
If you try to edit a a graph made in PowerPoint 2003 or a previous version of PowerPoint using PowerPoint 2007 or a later version, you’ll find that it is a bit different. You will be able to edit the graph, but all editing options will not be available.
Converting Old Graphs into the New Format
All you need to do, is double click the graph and you should get an option to convert the graph. You can use this to easily convert all the graphs. This is helpful if you’re going to be working with other graphs in the file as well. This will also save you a lot of time in converting every graph individually. The conversion might take some time depending on the number of graphs in the file, and the conversion may not be 100% accurate.
After converting the graphs, make sure to save the file as a newer PowerPoint file format. If you save the files with the old formatting, this will convert the graphs back in to the old format and may cause some distortion in the graphs due to multiple conversions.

Leave a Reply