
PowerPoint allows you to make charts by using its built-in features. This works well for making simple graphs. However, if you need to make graphs from math equations, then you might not be used to do that with the PowerPoint graph maker alone.
For that, you will need some additional software. Here, we will tell you about two software programs one is a web app and the other is a software that you install on your computer.
Here we go!
Use FooPlot To Make Basic Charts From Equations
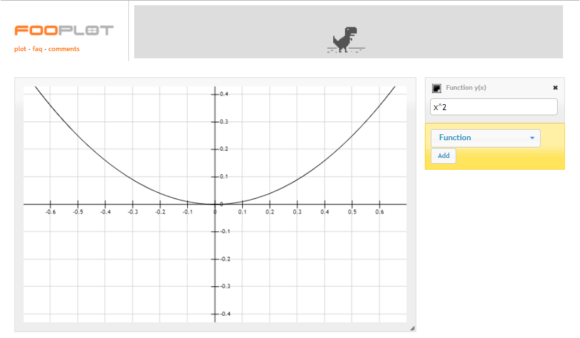
FooPlot is a free tool that anyone can use in a web browser. You can use it to plot equations. It’s very quick to begin using it since it opens in your web browser in seconds. And the best part is that it’s free.
FooPlot allows you to save your charts to SVG or PNG format. If you download the chart in SVG format and insert it in PowerPoint then you can make it as big or small as you want and it will not get distorted since PowerPoint supports SVG file format.
If this software isn’t enough then there is another option which should suit everyone needs.
Use MatLab To Make Advanced Charts From Equations
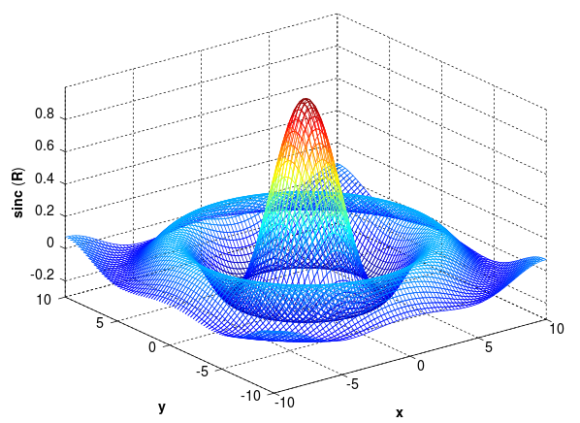
Matlab is a software used by millions of engineers and scientists. It contains tools made for professionals and includes interactive applications to see how an algorithm works with data. So, it should be enough for even the most demanding users of PowerPoint.
Matlab allows you to export your graphs to a PowerPoint friendly format by using a smart PowerPoint exporter. This to convert the chart into a set of objects which you can manipulate as you choose fit once you insert them in PowerPoint.
Thank You For Reading This Article!
If you liked it then please Share and Comment below.
Have A Nice Day 🙂
Leave a Reply