Free Graphics Sampler PowerPoint Template
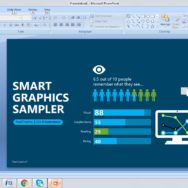
Use smart graphics according to the theme and subject of the presentation to make it impactful. Presentations dealing with percentages …

Use smart graphics according to the theme and subject of the presentation to make it impactful. Presentations dealing with percentages …
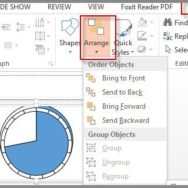
Add impact to text related to time management or project deadline in your presentation slide by making the below clock …
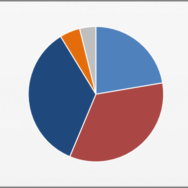
Charts and graphs are shown to the audience to help them easily understand the data which is being presented. Figuring …
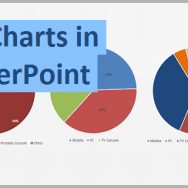
Pie charts are commonly used to show parts of a whole. They consist of a circle divided in different parts. …
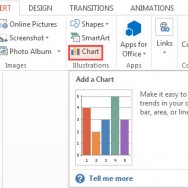
Pie Charts and Bar Charts are visual tools to spot trends and patterns. It is much more effective to explain …