
Pie Charts and Bar Charts are visual tools to spot trends and patterns. It is much more effective to explain facts with the help of charts, than it is with numbers. The best practice is to include Charts as well as Tables in a single free PowerPoint presentation. The following tutorial explains how to Insert a Chart in PowerPoint 2013. The simplest methods include: inserting through the Ribbon, and through the Insert Chart placeholder. Each of these ways gives access to the 10 common types of charts.
Insert a Chart through the Ribbon
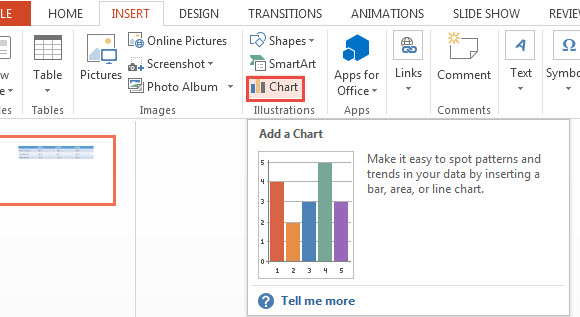
Open a new clear blank presentation or a new slide. Click the INSERT tab on the Ribbon. Under the Illustrations group, click the Chart button.
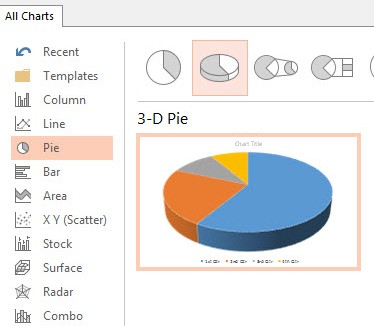
A dialog box appears, which includes all charts included in PowerPoint 2013. Options include predefined templates, Line Chart, Bar Chart, Column Charts. Each chart has its variation in cluster and stack forms. Users have the option to change the dimension of a chart, depending upon number of quantities, constraints, etc.
Insert a Chart through the Insert Chart Placeholder
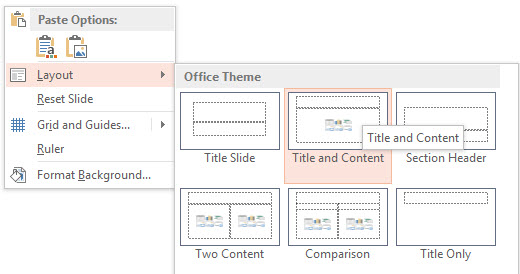
Delete an existing placeholder. Do this by Inserting a new slide, clicking on the boundary of a placeholder, and pressing the Delete key. This creates a space on the new slide, which does not have a placeholder. Now Right Click the empty portion of the slide, and click Layout from the Contextual menu. The Office theme menu appears. Select a placeholder, containing the Chart option (as shown in the figure below). The placeholder is added. Now click the Chart button to insert a chart anywhere on the slide. Now you have the option to make as many new slides as you want with the Insert Chart Placeholder included in them.
The above tutorial explains the basic ways of how to insert a Chart in PowerPoint 2013. The first way is through the INSERT tab on the Ribbon, and the second is through the Insert Chart Placeholder. You may download the free Bubble Red presentation containing a Bar Chart and a Pie Chart.
Leave a Reply