A label helps identify a Chart or SmartArt. Labels are found on the horizontal and vertical axis, as well as the title of a Chart. Position of a label depends upon the chart type. The option to Change the Chart Type is available in PowerPoint. The tutorial below hon How To use labels in PowerPoint 2013 explains how to add a label, as well as how to modify it.
How To Add a Label
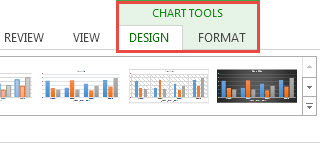
Firstly, insert a Chart. Now navigate to the contextual DESIGN tab under CHART TOOLS on the Ribbon.
On the Leftmost side of the screen, click the Add Chart Element button. This button is located under the Charts Layout group. A drop-down menu appears. The menu lists different elements of the chart where you can insert the label. Choose an element of the chart and its sub-type. You may hover the mouse over options to see their preview. Elements include: Axis titles, Grid lines, and legend.
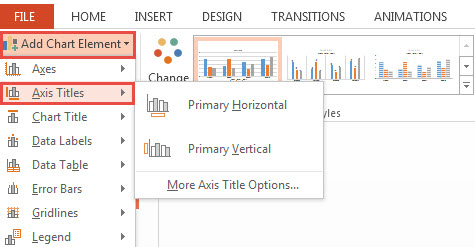
In case the label does not suit you, click the More option. This option is available for each chart element. It helps tune the label to your specifications.
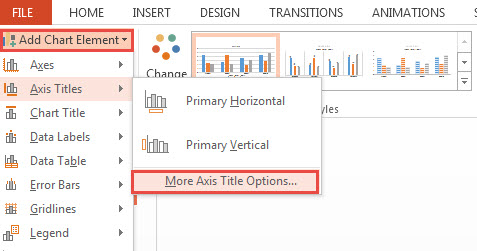
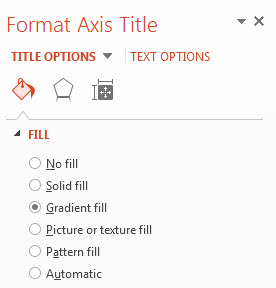
Upon clicking the More Label options, the format Label pane appears. Set the title options such as: Fill & Lines, Effects, and Size & Properties. You may also set the Text options, such as: Text fill & Outline, and Text Effects, and Textbox. Familiarize yourself with labels by practicing on free Yellow band theme that comes with a multilayer bar chart.
How To Modify/Edit Label
Simply click the label you want to edit. You have to click inside the label for the editing mode to start. Another way to edit label text is to Right Click the label and select Edit Text from the contextual menu.
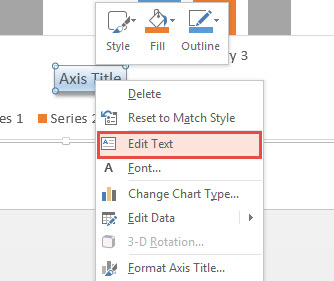
The above free tutorial on How to Use Labels in PPT 2013 explained how to create a label anywhere on a chart, as well as how to enter text inside the label. Create a label through the Add Chart Label button. Edit text by clicking inside the label.

Leave a Reply