
Most businesses need Variance Analysis to investigate their current performance and compare it to performance in the past. A professional might do a great job at analyzing variances but communicating the results of that analysis can become a challenge.
Here, we will try to make this challenge easier for you.
What Is Variance Analysis?
Variance analysis is an investigation of the difference (or variance) between actual and planned results. This analysis is very important in order to maintain control over a business. Variance analysis also involves the investigation of these differences.
How Will The Audience Understand The Analysis From This?
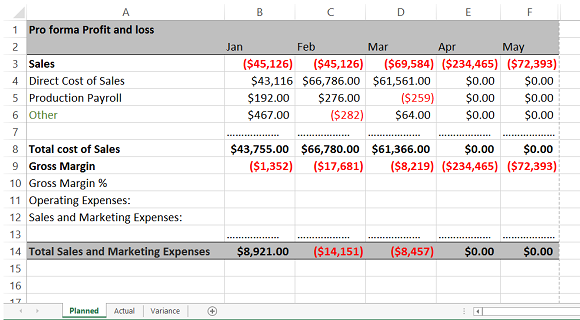
Many presenters simply copy and paste their spreadsheet from Excel to a PowerPoint slide. They then try to present the analysis from that slide without changing much at all. This can confuse the audience.
The audience usually doesn’t know where to look for relevant information when presented with a lot of numbers on it. Even when the presenter wants the audience to pay attention to a specific portion of this slide, they might not be able to do so promptly.
Things to Consider When Making a Visual for Variance Analysis
The visual needs to focus on key variances. Favorable ones and Unfavorable ones. It depends on your analysis. These are key variances that the management needs to look at.
You can also try building the variance chart piece by piece. Showing only one portion and than the rest of it, and then all of it. The first part being the title and beginning of the chart, then the Favorable Variances and finally the Unfavorable Variances.
Focus on Favorable Variances First
Show favorable variances first. For example, If costs were successfully kept under a a certain limit, then show that variance first. Some explanation is also very useful for each varience.
Showing Un Favorable Variances
Once you’ve shown favorable variances, its time to show the Un favorable ones. Give necessary explanation for certain variances if they are expected to increase in the future (e.g. expenses due to legal dispute). Since people tend to focus more on negative numbers, you should expect to give more explanation here.
But, What About The Rest of The Numbers?
You should upload the spreadsheet online and provide a link to your presentation and the Variance Analysis spreadsheet. Mention to everyone that they can see all the numbers by looking at the spreadsheet online.
If you expect someone to ask a question about the data during the presentation, then you can choose to include the Variance Analysis spreadsheet after the final slide or as a hidden slide.
Leave a Reply