
Infographics can be great way to show information visually. An inforgraphic is usually made of visual graphs. This graph can be of any type as long as it helps people understand the data quickly and easily. An infographic is a multi-layered message that uses colors and patterns to make the message easier to understand. It boosts cognition and retention of the message as well. Even though nothing changes about the data except for its presentation. Here, we will be talking about infographics and how you can use them effectively.
When To Use An Infographic?
Using an infographic is useful when the audience is not knowledgeable about the details of the subject. It may also be useful for an uninterested or passive crowd.
How To Use An Infographic in PowerPoint?
Showing a whole infographic to the audience can be a bit too much. There is simply too much information on most of them. If you start going through many of the data points on a static infographic, it will just bore people. You should instead reveal the whole image in parts. Show more of the image as you explain it. This should help keep people’s attention.
Now, you can either reveal the image using exit animations, or you can use slide transition effects. Both of them are pretty easy to make. You just need to decide which approach works best for you. To make an exit animation, all you need to do is to draw a shape on the part of the infographic that you don’t want people to see. Then, choose an animation effect to reveal the hidden portion. You can read more about it by clicking here.
But, what if the background you’re using for the slide is not a uniform color. In that case you might want to use a slide transition effect to hide part of the image you don’t want people to see yet. You can do this by cropping out parts of the image into different slides. Revel more of it on the next slide. You can use slide transition effects to make it look like a smooth transition. Read more about it by clicking here.
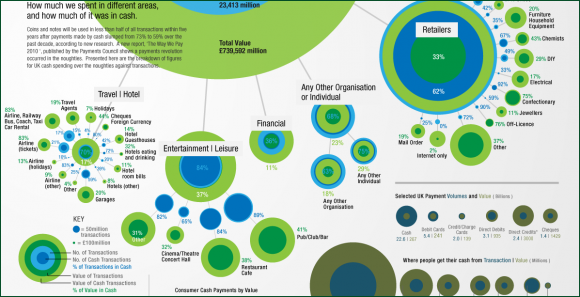
Image Courtesy:
UK Spending by GDS Infographics [CC BY 2.0] via Flickr
GLAM-Wiki Infographic [CC BY 3.0] via Wikimedia Commons
Email Self-Defense Infographic [CC BY 4.0] via Wikimedia Commons
Leave a Reply