
If you have created a presentation or downloaded a free PowerPoint theme with chart A and want to replace it with another chart, this guide is for you. First, have a reason to replace the chart. A certain type of chart may be ideal to illustrate relationships and trends, but not necessarily comparing items or facts. Before learning how to Change chart type in PowerPoint 2013, it is assumed that you know how to insert charts, and how to enter data into them.
Change Chart Type
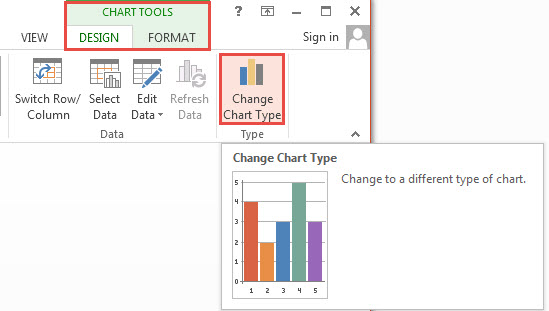
First, select the chart. Navigate to CHART TOOLS found on the Ribbon. Now click the contextual DESIGN tab. Navigate to the Type group and click Change Chart Type. A dialog box appears to Change Chart Type. Select the replacement chart and its subtype. The chart type changes once you click OK.
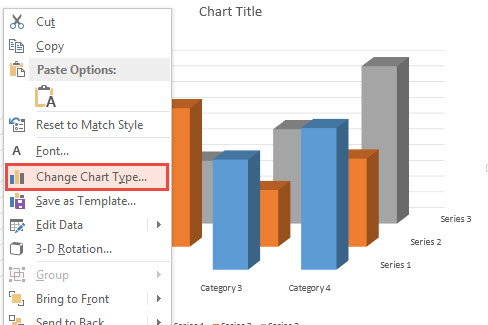
An alternative way to change the type of chart is to Right Click anywhere on the chart. A contextual menu appears. Select Change Chart Type from the menu. Select the required type of chart from the dialog box and click OK. The process does not involve re-entering data into the new chart, as the data is NOT altered throughout the process.
Practice How to Change Chart Type in PPT 2013 with the free Waves theme, which comes with a bar chart.
Leave a Reply