
Learn how to create a table in PowerPoint 2013 through some easy to follow steps. The diagrams below explain the simple way of specifying rows (horizontal cells) and columns (vertical cells) in the table. This is the first of a series of tutorials on manipulating Tables. If you are looking for a ready-made free presentation with tables, charts and SmartArt, take a look at Blue Border and free Business Beige presentations.
How To Create a Table
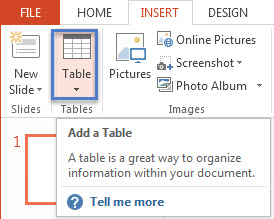
Select the slide where you require a table. Click the INSERT tab on the Ribbon. Click the Table button under the Tables column. You see a grid appear underneath the Table button. Highlight the mouse pointer over the grid to get a preview of the number of rows and columns. Make sure there is enough free space for the table, such that it does not overlap with the placeholder content.
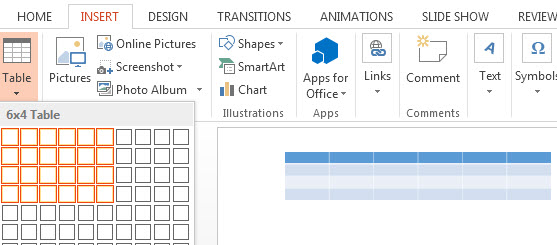
The grid is a fast method of creating an ideal sized table. The table size is displayed on top of the grid. 6×4 represents a table with six rows and four columns. In case the size of your table is different from the original requirement, follow the simple way below to change the table size.
An alternate way of inserting a table to click on the INSERT tab, followed by the Table button. Below the grid, click on Insert Table. Now specify the required rows and columns in the dialog box.
Insert or Delete a Rows & Columns
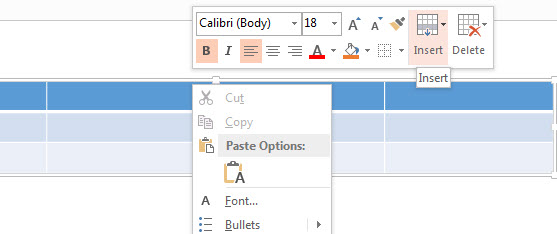
To Insert or Delete a portion or the whole table in your free business PowerPoint presentation , Right-Click anywhere on the table. A toolbar appears. To Insert a row or column, click Insert. Add a row to the top or bottom. Alternatively, add a column to the left or right. To delete a row, a column, or the entire table, click the Delete button.
The above tutorial provides a couple of ways to Create a Table in PowerPoint 2013, and to modify the table later. For a ready-made 3×3 table, download Green border PPT template.
Leave a Reply