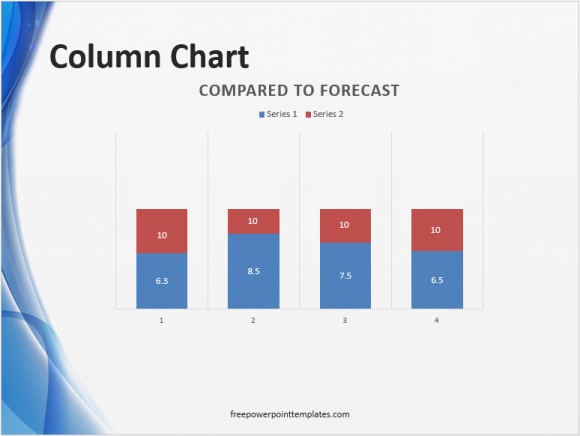
Figures – Forecast Comparison Chart – 2 – FreePowerPointTemplates Go back to Presenting Performance Figures in PowerPoint